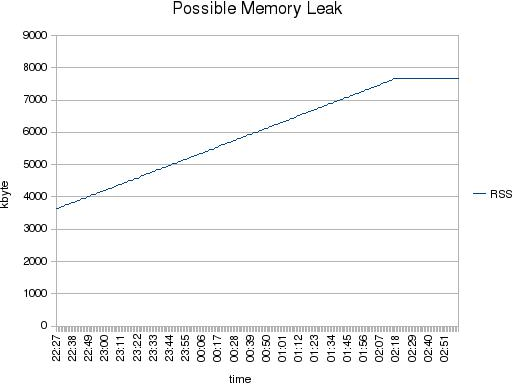
A customer has recently experienced a possible memory leak in its NDB-API application. What he did was something like:
# ps aux | grep <pid>
over time and then he saw the RSS increasing. When he would have had a look a little longer he would have seen that the RSS consumption would increase up to a certain level and then becomes stable. Which is the expected behavior.

But how to explain to the customer that his application, which was in fact not doing anything, consumes more RSS?
With a diff over …